About the database
The Energy End Use Database (EEUD) was developed by EECA and provides the latest data on energy use in New Zealand homes and businesses, use of fossil fuel and low-carbon energy, and how the transition to low-carbon energy is tracking between January 1, 2017 to December 31, 2022.
The dataset is available as an online data visualisation application showcasing the results with a user-friendly interactive interface. The data is also available as a downloadable spreadsheet of the entire dataset.
The tool uses annual energy demand data from MBIE and delivered energy estimates are provided for fuel types, sectors, end uses and technologies.
The ‘end use’ values expressed in the EEUD represent how delivered energy is split between its uses in given sectors. The delivered energy end use values are different to the ‘actual’ end use energy volumes when efficiencies and losses are accounted for.
Insights summary from the latest data
Manufacturing in the dairy, petrochemicals, metals, and wood sectors continue to dominate business stationary energy consumption in New Zealand. High and intermediate temperature process heat and boiler systems continue to be the primary end uses and technology. The top insights include:
- Renewables primarily in the form of biomass and geothermal are used significantly in the wood, pulp and paper sectors.
- Motive power, mobile is about 14% of all stationary energy consumption. This is mainly diesel and petrol used in offroad vehicles (i.e. diggers, tractors) and marine vehicles (recreational boating).
- The industry sector group has showed a promising increase in renewables and a decrease in fossils from 2021 to 2022.
- The commercial sector has shown a 10% increase in fossil fuels from 2021 to 2022. This is mainly driven by more diesel use for offroad vehicles and boiler systems.
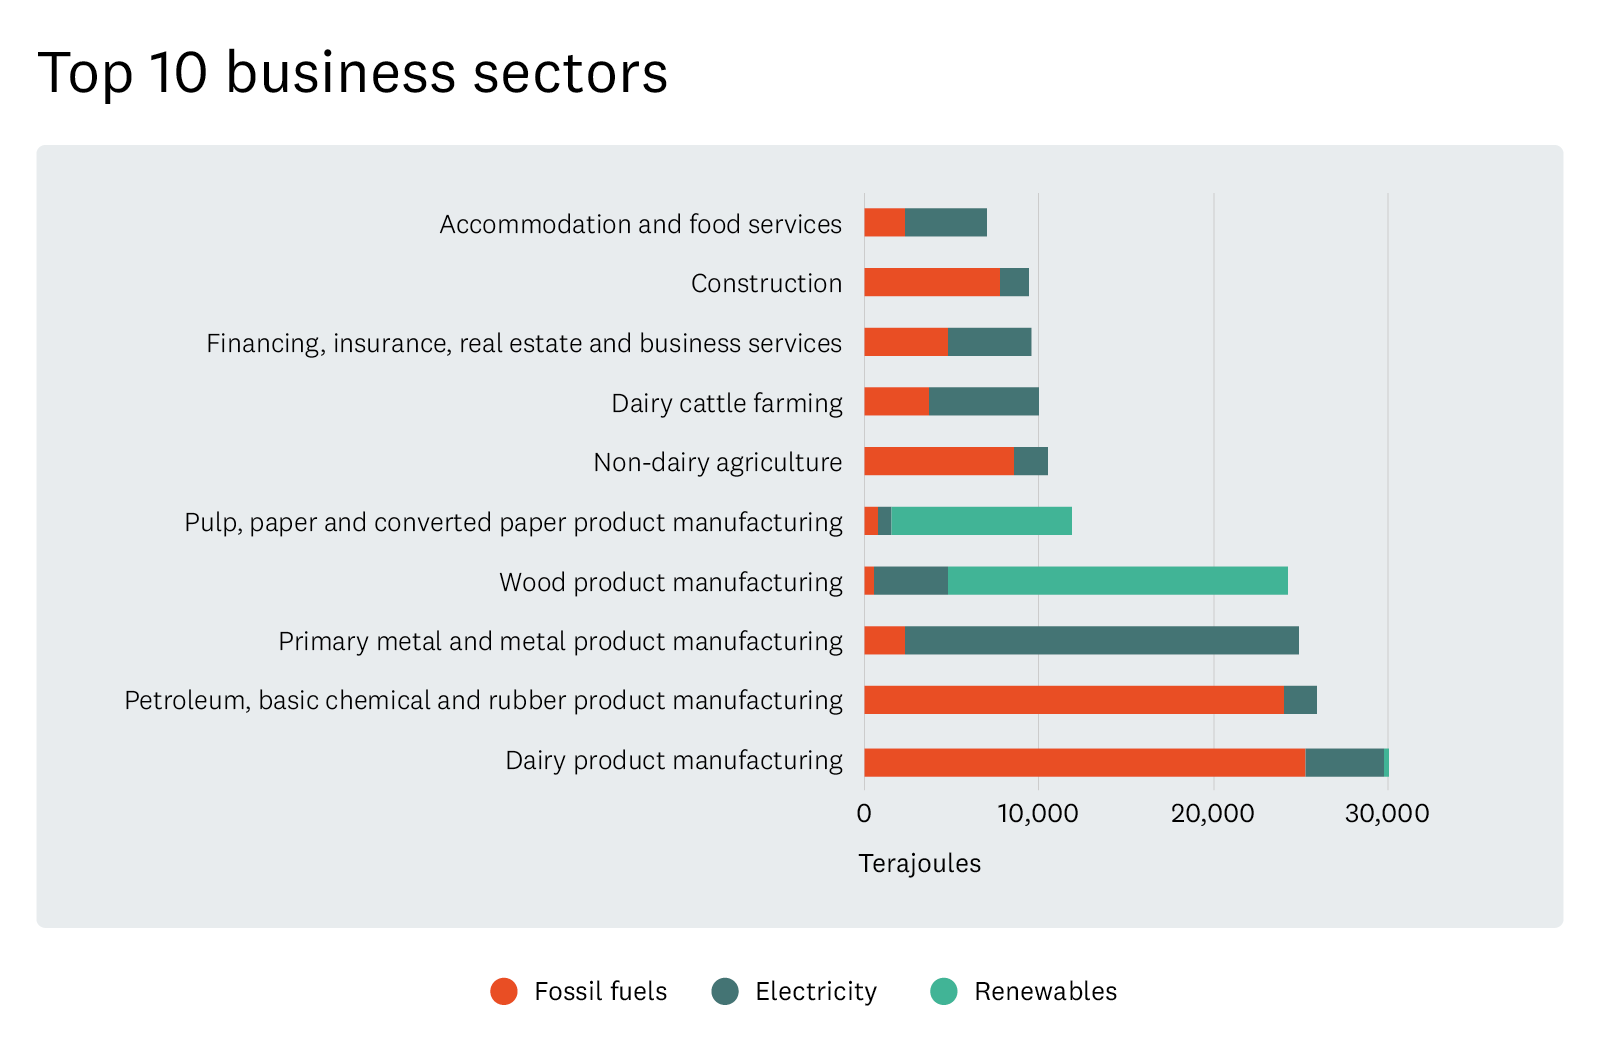
- Dairy product manufacturing, petrochemical manufacturing, and the primary metals sectors are New Zealand's largest energy consuming industrial sectors, making up 32% of total business stationary energy consumption.
Sector insights
Dairy product manufacturing
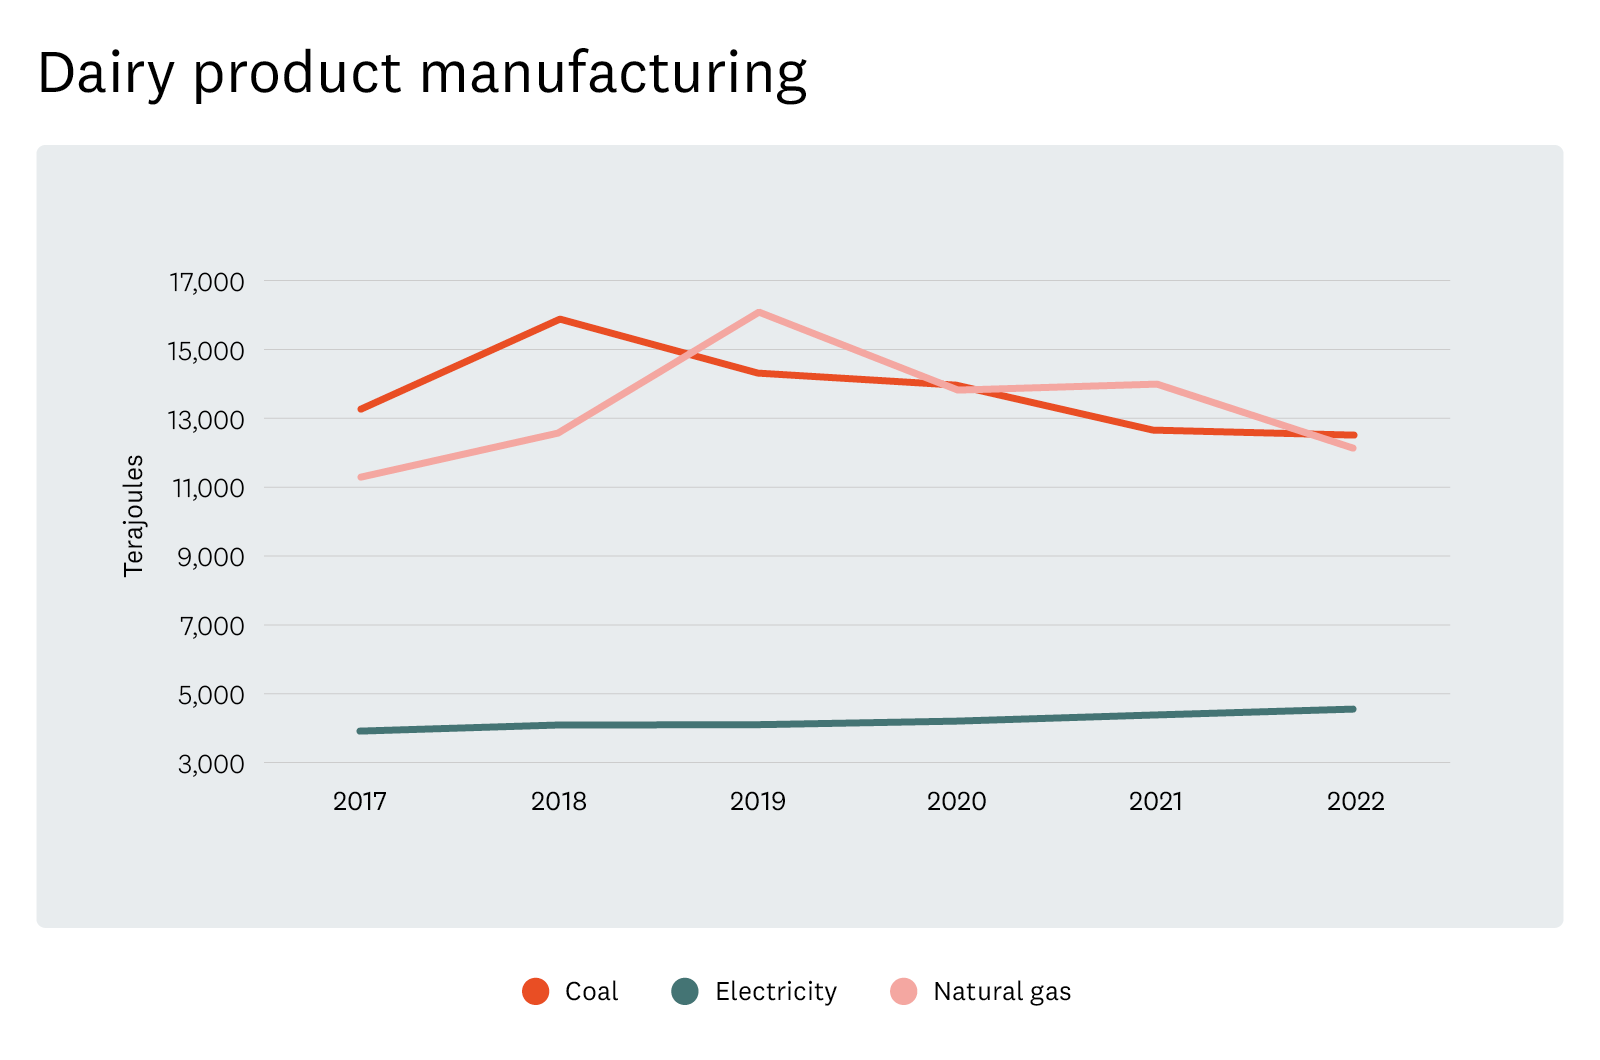
The dairy product manufacturing sector is the largest stationery energy using sector in New Zealand, accounting for around 18% of all industrial stationary energy use in 2022.
Coal consumption has been decreasing year on year since 2018 and fossil gas consumption has been decreasing year on year since 2019. Electricity has increased over the same periods. These are positive trends for the sector’s decarbonisation. Fonterra’s Te Awamutu site had its first full year in 2022 of operating with wood pellets, replacing coal. This change would have contributed to the coal reduction. Several industrial decarbonisation projects across the sector also became operational across 2023 (e.g. fuel switching projects at sites for Open Country Dairy, Synlait, Fonterra, and Mataura Valley Milk), and it’s anticipated the trend will continue in the 2023 data and into 2024 as more industrial decarbonisation projects become operational.
Petrochemical product manufacturing
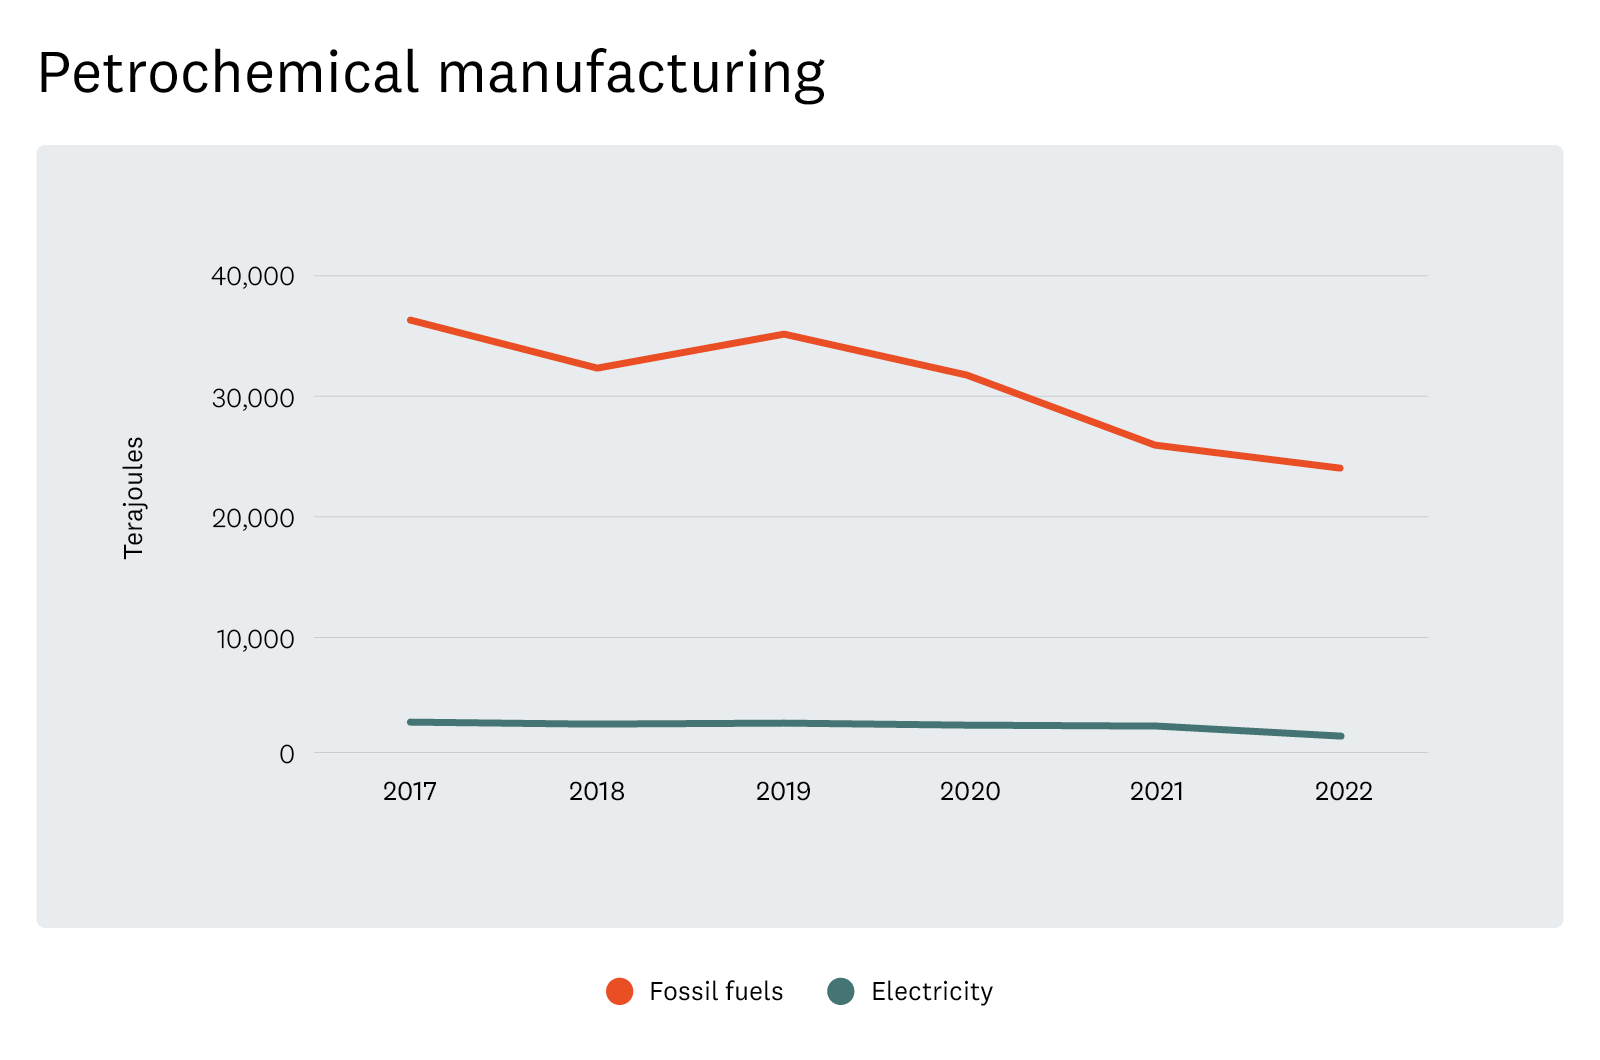
The Petrochemical product manufacturing sector is another large energy using sector in New Zealand. It accounted for around 15% of all industrial stationary energy use in 2022. Fossil fuel use has been trending down since 2019 due to a mix of factors including 2020 Covid lockdown impacts, Methanex’s Waitara Valley plant closure and Marsden Point Oil Refinery closure. Cyclone Gabrielle in 2022 also impacted operations in Napier for smaller players in the industry.
Meat and seafood product manufacturing
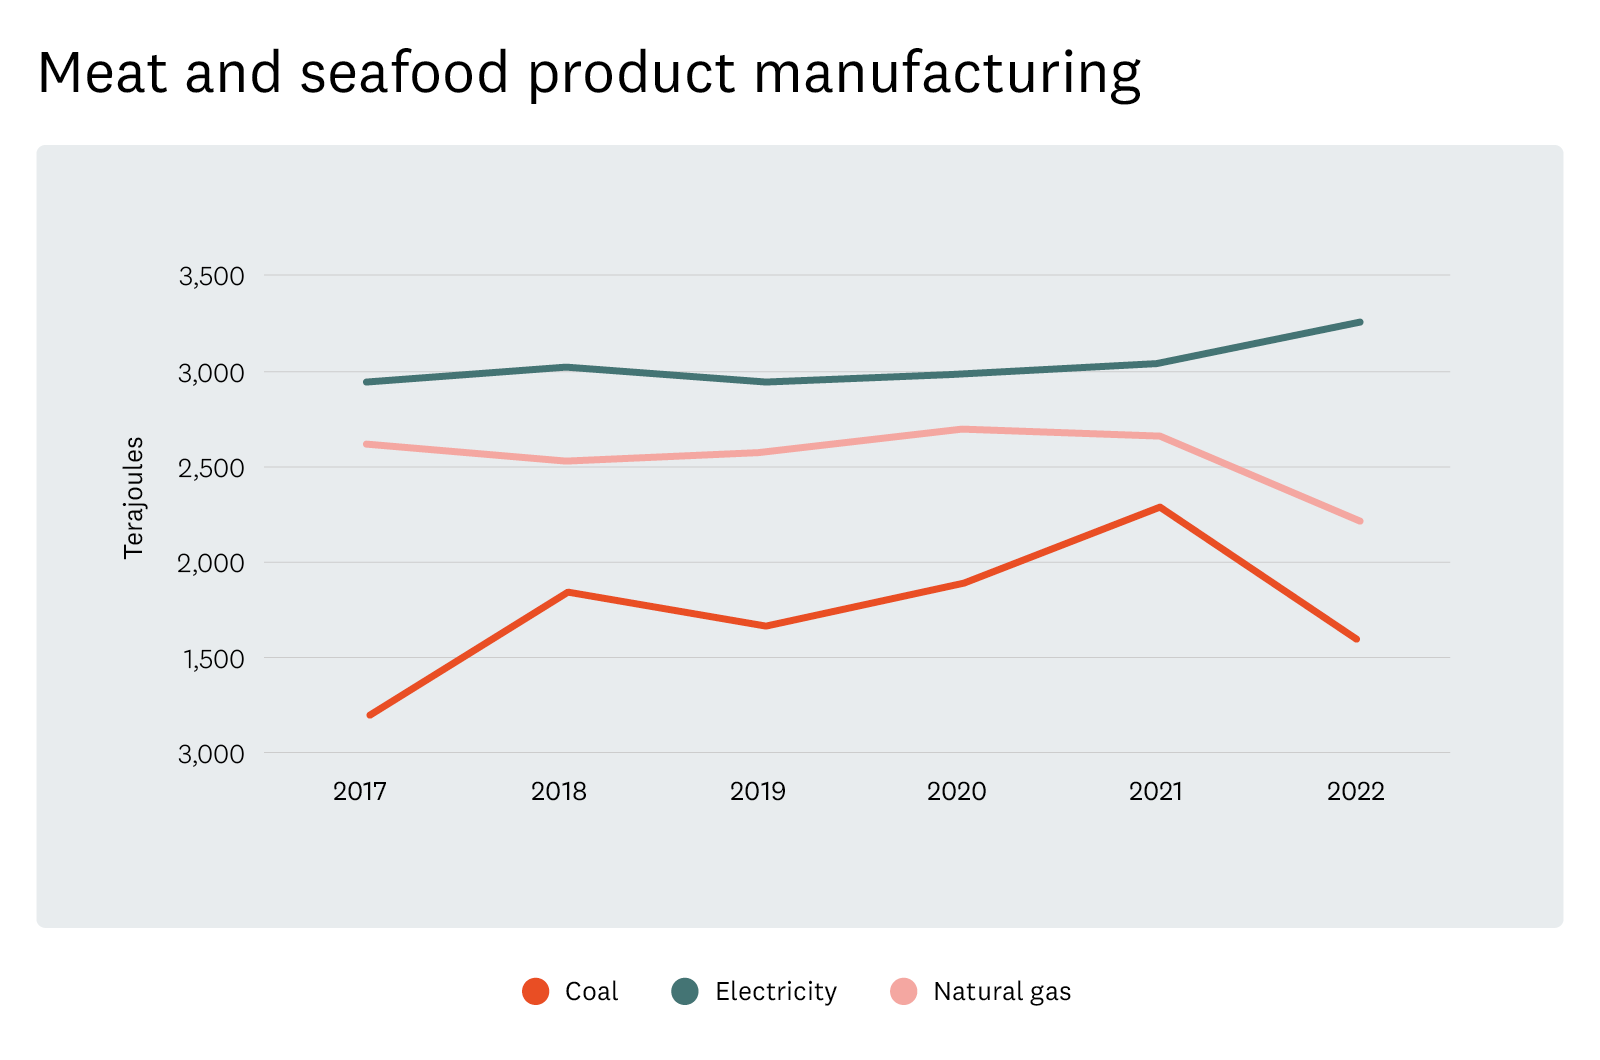
Despite not being in the top 10 of energy-using sectors its important to highlight the strong dips in coal and fossil gas use in the meat and seafood product manufacturing sector between 2021 and 2022. Coal fell by 30% and fossil gas by 17%. Across the same period, electricity increased by 7%. The fluctuations can be linked to decarbonisation interventions in the sector, such as biomass replacing coal at AFFCO’s Moerewa site, and high temperature heat pumps replacing coal boilers at ANZCO’s Ashburton site, and at Alliance’s Nelson site. As with the dairy products sector, several industrial decarbonisation projects across the meat products sector also became operational across 2023 (e.g. fuel switching projects at sites for Alliance, AFFCO, ANZCO), and the trend is expected to continue in 2023 data.
About the data
The EEUD was initially created by EECA in 2007. EECA revised and improved the quality of the database in 2018. An improved dataset was released publicly in 2020 and was available as open data.
Open data website(external link)
In November 2021 the updated dataset was released as an online data visualisation application showcasing the results with a user-friendly interactive interface. The data is also available as a downloadable spreadsheet of the entire dataset. Energy use estimates are derived using a ‘top down’ approach based on MBIE’s annual high-level sector/fuel energy demand data and proportioned into further disaggregated sectors, end use applications and technology values using ‘bottom up’ data held by EECA.
In April 2022, the transport data methodology was updated and now expresses an enhanced breakdown of technologies and transport modes. This update was based upon Waka Kotahi, Ministry of Transport and EECA data. The updated data provides insights into battery electric vehicles, passenger and freight rail, and heavy trucks.
In June 2024, EECA released a new version of the online data visualisation tool. The new version has enhanced functionality including filters with multi-selection ability.
For more information about the EEUD, please email info@eeca.govt.nz
Find out more here
Read next
-
Red meat, green energy
By switching to cleaner technologies, Alliance Group is helping reduce Southland’s carbon footprint.
- Case study
- Decarbonisation
- Process heat
12 October 2022
-
Cutting coal and carbon emissions at Silver Fern Farms
Switching away from coal will help industry-leading company reduce carbon emissions and save money.
- Co-funding
15 December 2021
-
Fonterra | Coal boiler conversion
Fuel switching captures economic and climate benefits for Fonterra.
- Case study
- Innovation
- Fuel switching
26 July 2021