Business information
-
Company: NZ Post
-
Industry: Postal Service
-
Number of employees: 4700 (not including contractors)
-
Site region: Nationwide
-
Fund: Low Emissions Vehicle Contestable Fund (LEVCF)
-
Year of funding: 2018
Project summary
NZ Post is the one of the largest and longest standing companies in New Zealand – having been around for 170 years. Their vehicle fleet is the largest asset in their mission, meeting Kiwis’ ‘mailing needs both physically and digitally’. In an urban and rural environment, the fleet of NZ Post and their contractors and partners is significantly reliant on diesel and petrol vehicles.
The company has committed to reducing their carbon impact and has set a goal to reduce greenhouse gas emissions by 32% by 2030, compared to 2018. They’re also a Toitū carbonreduce certified organisation, which means they’ve measured and managed the operational emissions of their organisation.
NZ Post generated close to 118,000 tonnes of CO2e in FY18, and ground transport produced approximately 50,000 tC02e of those emissions. There are around 1500 vehicles in NZ Post’s contractor fleet, of which 600 are in the Rural Post contracted fleet. With such a large fleet, NZ Post’s business model heavily relies on the capabilities and range of their delivery fleet. As part of their commitment to reducing emissions, with support from EECA’s Low Emissions Vehicle Contestable Fund (now known as the Low Emission Transport Fund), NZ Post trialled eight electric vans in their courier fleet during 2018 and 2019.
The vans were trialled in both urban and rural delivery networks and were demonstrated throughout New Zealand to maximise exposure to drivers from all over the country. Urban route drivers typically travelled 80–100 km per day, with routes maxing out at 150km in the rural setting.
The electric van models and their ICE (internal combustion engine) equivalents used for comparison are as below.
| Model | 2019 Renault Kangoo Maxi ZE 31kWh (EV) |
2014 Volkswagen Caddy (ICE) |
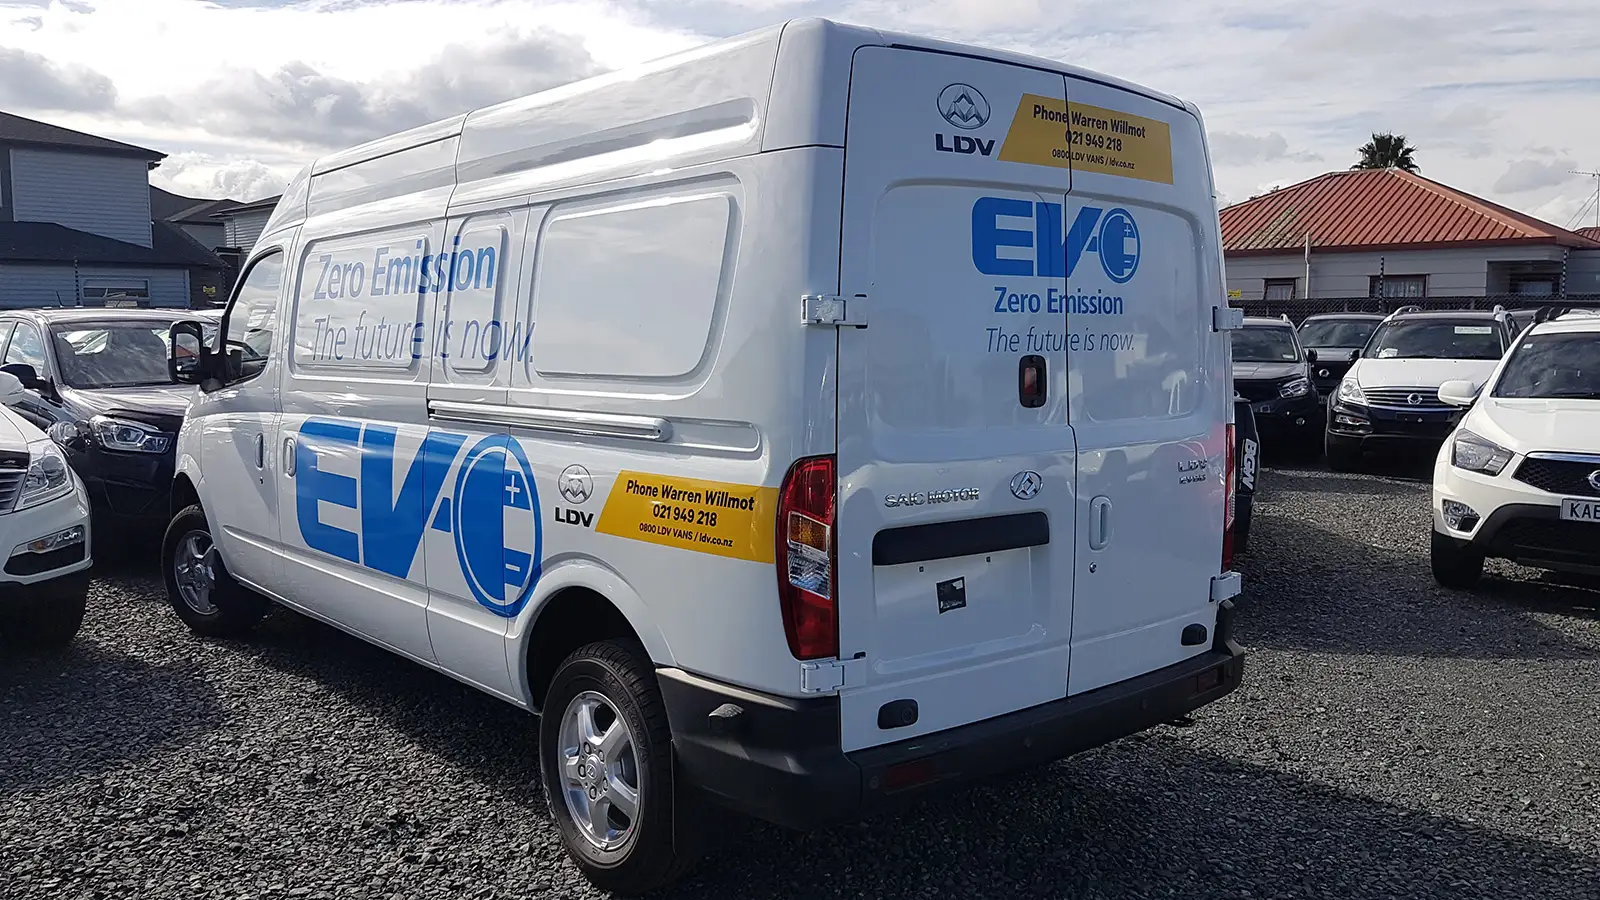
2018 LDV EV80 Cargo Van 56kWh (EV) |
LDV V80 2500 (ICE) |
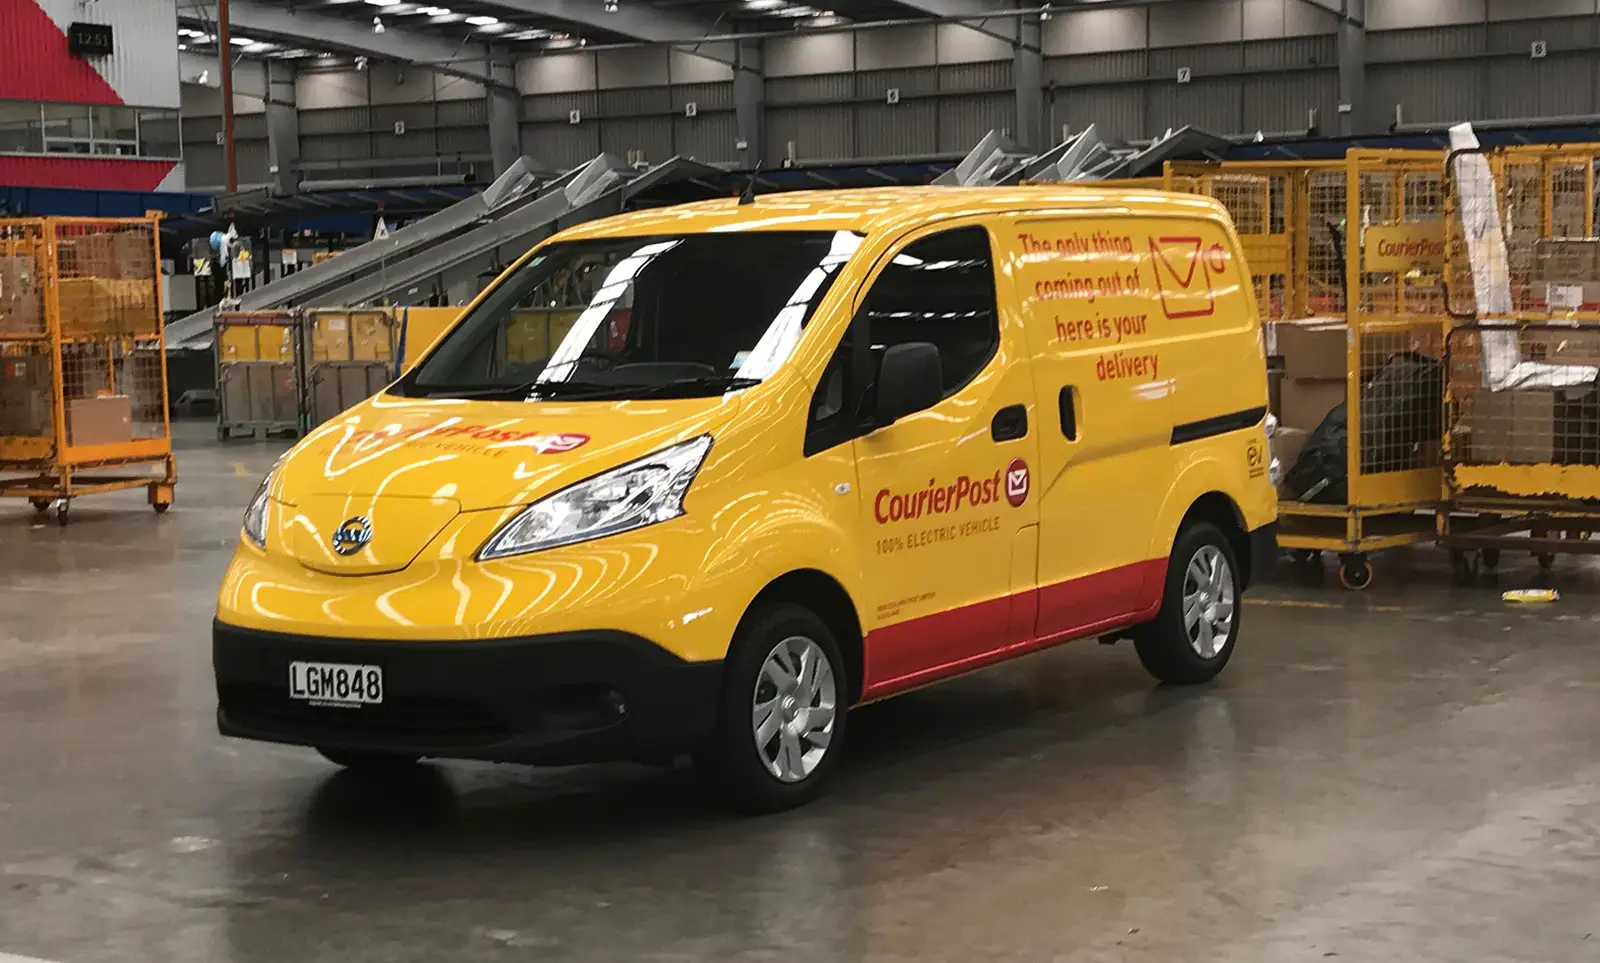
2016 Nissan ENV200 Acenta Rapid 24kWh (EV) |
2016 Nissan NV200 (ICE) |
| Route | Rural | Rural | Urban | Urban | Urban | Urban |
| Type | Electric | Diesel | Electric | Diesel | Electric | Petrol |
| Price ($) | 55,000 | 38,990 | 48,000 | 37,000 | 55,000 | 30,000 |
| Range (km) | 165 | N/A | 140 | N/A | 200 | N/A |
| Vehicle emissions (g CO2-e/km) |
21 | 210 | 36 | 266 | 21 | 176 |
| Capacity (m3) | 4 | 4 | 10 | 10 | 4.2 | 4.5 |
About the project
This co-funded pilot with NZ Post was trialled in rural and urban areas in 2019 once the electric vans were purchased and delivered. Seven chargers were also installed to ensure the vans had access to long-term charging when not travelling on working days.
The three 2019 Renault Kangoo (operated by Grant Bagshaw Ltd) and the four 2018 LDV EV80 Cargo Van were chosen by NZ Post because of the cargo specifications and payload of the vehicle, compared to their diesel counterparts.
The emissions savings target, if the fleet switched to electric, could be up to 38% of their total emissions. Another ambition of NZ Post was to provide passed-on benefits to their contractors through lower emissions, less noise pollution, and the reduction of operational costs by removing petrol.
Project results
Six months of trialling proved the electric vans to be both economic and practical options for NZ Post fleets. Vehicle-based emissions reduced by approximately 90%, and drivers saw an 80% reduction in fuel costs and a 50% reduction in maintenance costs (service and maintenance costs for the Renault Kangoos were reduced by up to 70%). Throughout the project, the LDV e-Vans had driven 17,052 kms while using only $683 worth of electricity.
In terms of performance, range anxiety was a perceived barrier to overcome for rural drivers before the project began. A big impact on van performance in the rural areas is the constant stopping of the vehicles, however they still achieved a good range of 4.7 Km- 5.3 Km per kWh. In the operational environment, the necessary range was being achieved even with the delivery loads. The newer e-Vans have a greater range of 200-330km, which is what NZ Post are looking at moving into post the project.
Overall, couriers found the vans comfortable and smooth to drive and there were no concerns with the EV engine. The only concerns stemmed from the lack of a rear-view window and sliding doors on both sides. In an urban environment, Auckland and Wellington drivers scored the experience between 8 and 9 out of 10, accompanied by comments like 'good to drive, missing the sliding door on the right, very spacious, and range not an issue'.
The project has had a positive influence on staff and partners of the organisation alike. Since it started, NZ Post have commenced other complementary projects including a study on charger impact, piloting EVs in rural areas, and a commitment to pilot EVs in their owned fleet.
Total cost of ownership
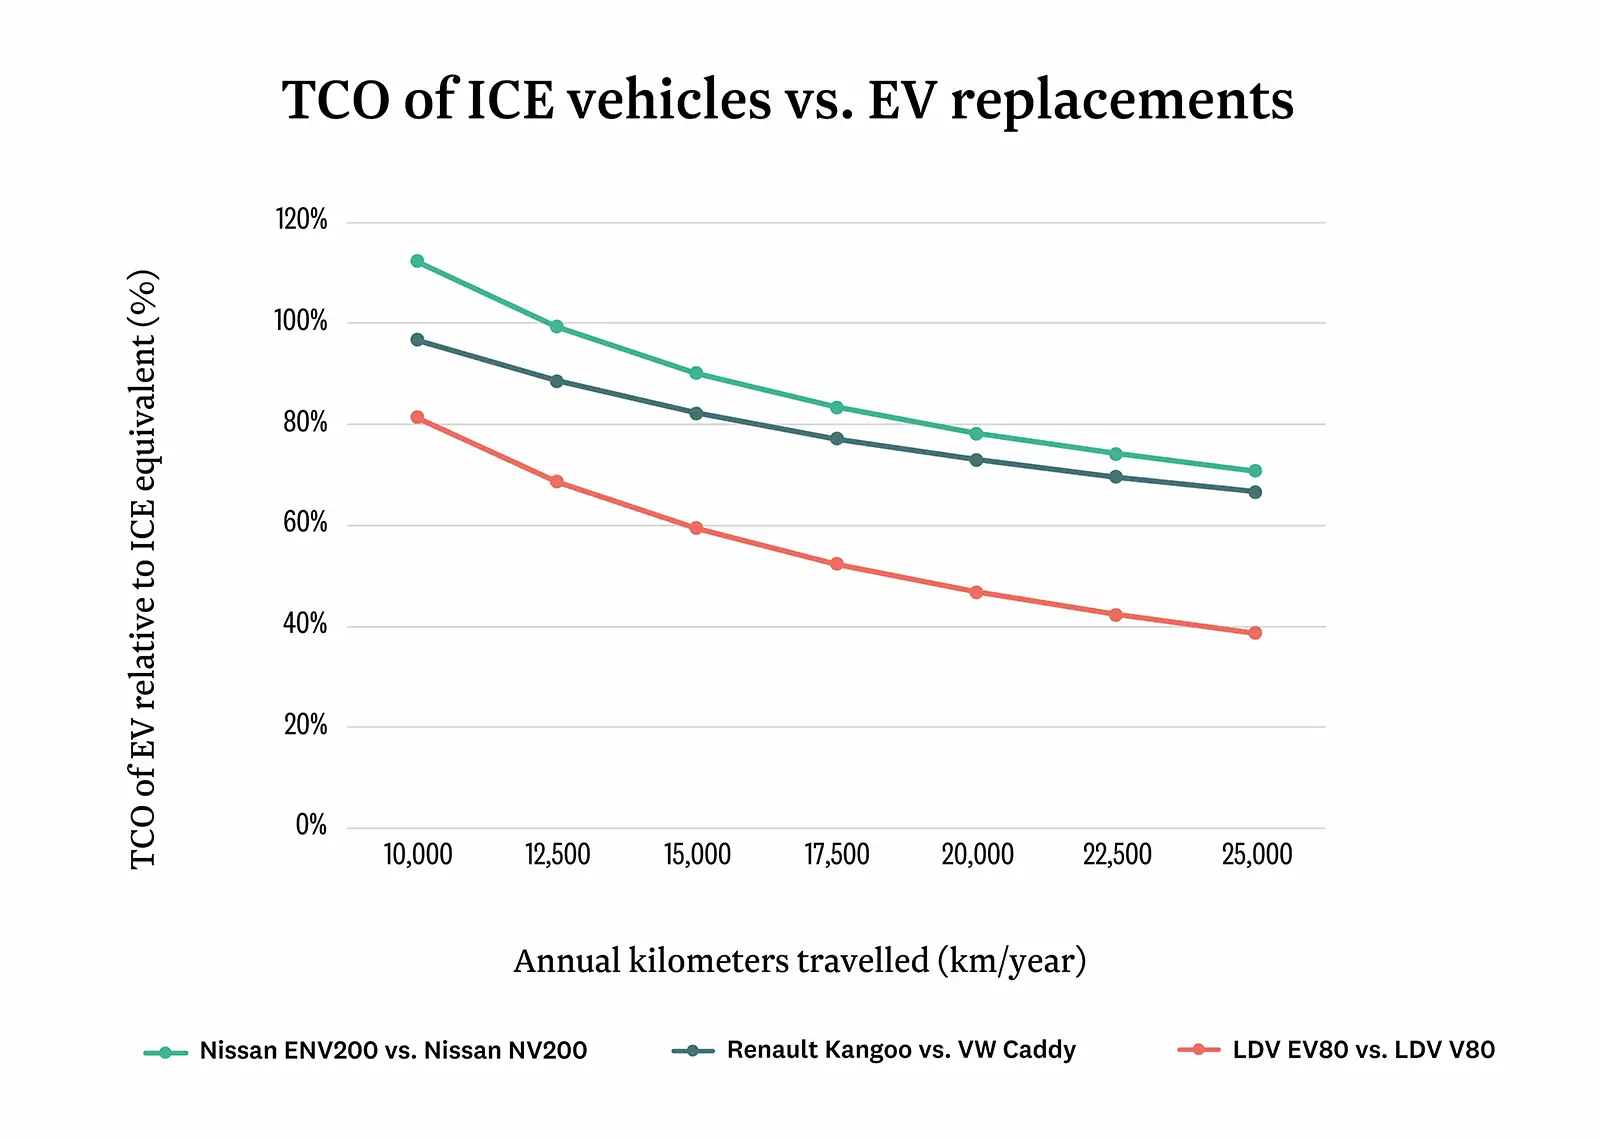
A total cost of ownership (TCO) model representing five years of ownership demonstrates the economics of the electric van options.
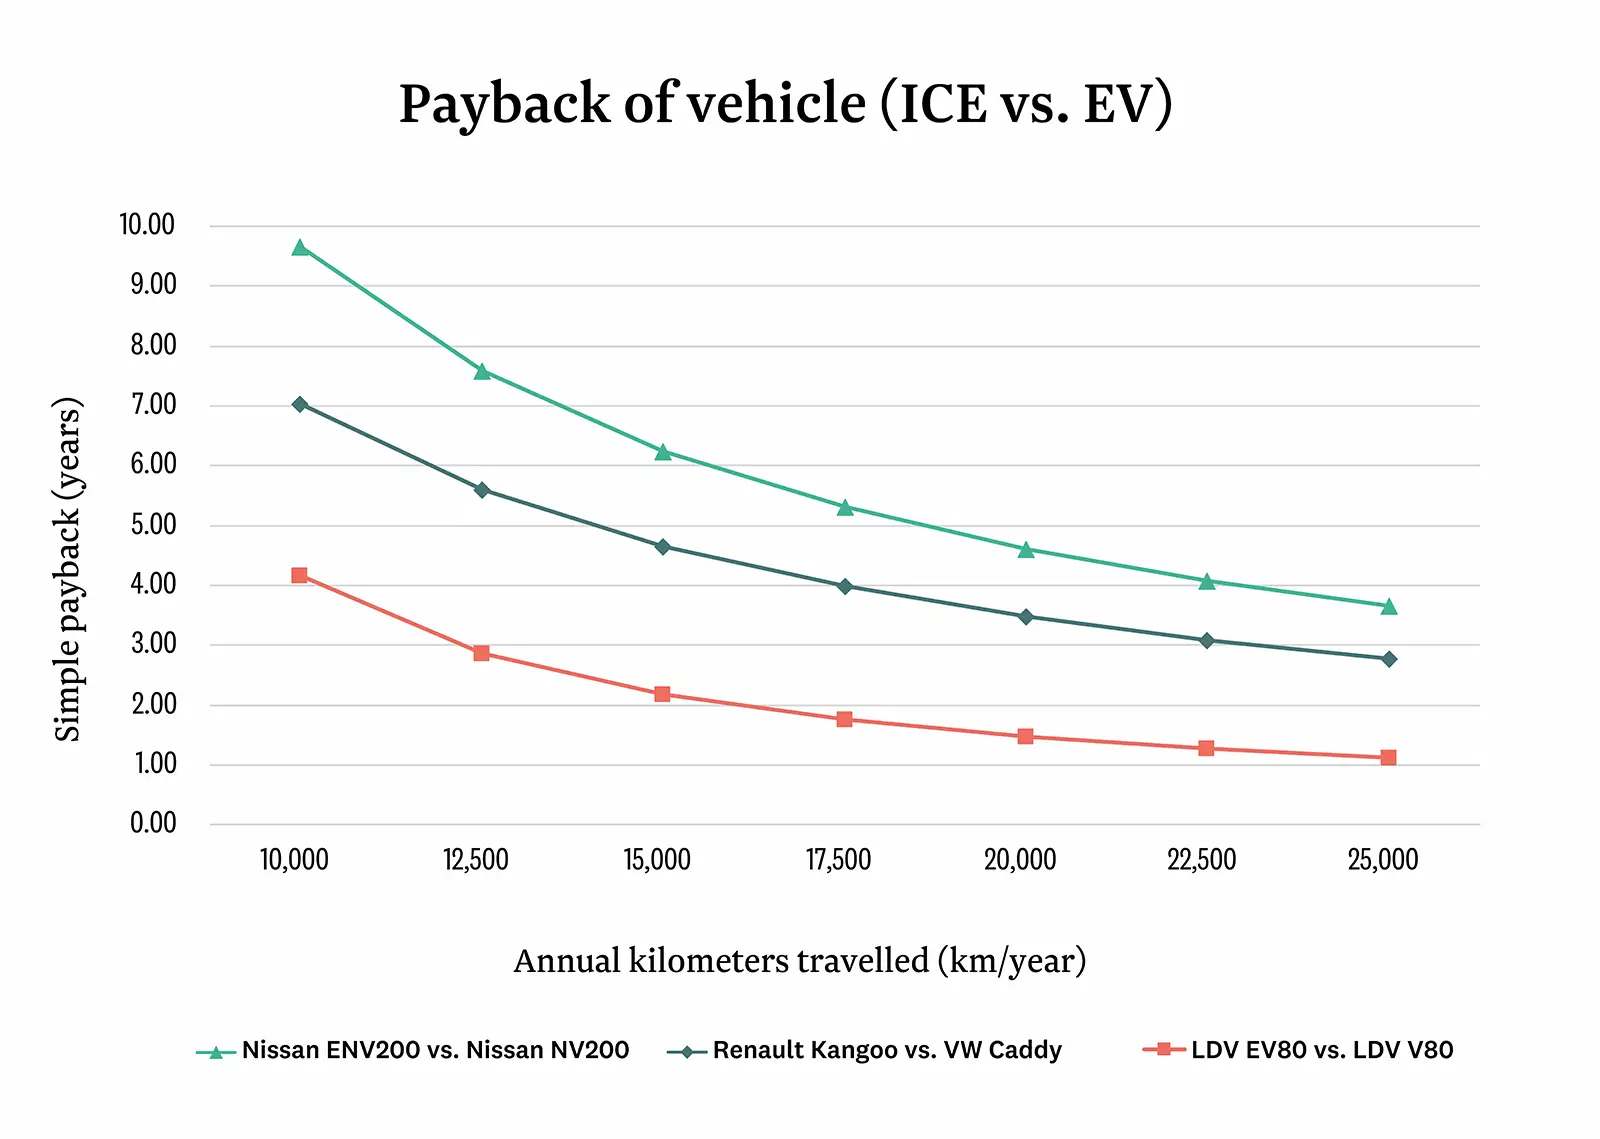
We have mapped the simple payback and TCO of the EV models NZ Post used, compared with their ICE equivalents over various annual distances travelled.
The relatively low operating cost of electric vehicles makes the distance travelled per year, the duration of ownership, and the relative efficiency of the vehicles the most important variables in a TCO assessment. The range and therefore use of the van is most affected by the weight of deliveries, tyre pressure, hills on routes, and heating requirements.
In order to recover the cost of NZ Post’s investment, these van models needed to travel 15,000 kilometres per year. During the trial period (June 2018 –June 2019), the electric vans travelled 17,052kms, averaging out at 1,421kms per month or 67km per working day. At this utilisation rate, payback is very achievable within 8 months and the TCO of the EVs on average was 13% lower than their ICE equivalents.
The cost of private charging infrastructure was excluded as chargers can realistically be expected to last much longer than the modelled five years. Including this cost has a minor effect (2% increase) on the TCO of the electric alternatives. The cost of seven chargers totalled $23,450.
As new models continue to be released, ranges increase, and purchase prices decline, the use of electric vans for delivery-based services such as couriers, food delivery, laundry and sanitary services, and tourism operations becomes increasingly appealing.
Advice and lessons
NZ Post say that the vehicles have been 'invaluable in providing staff and fleet partners the opportunity to get familiar with and learn about EVs'.
For others looking at electric vans, NZ Post's advice is to run a trial first and understand the vehicle's specs versus needs, as well as the impact in cost and resources of charging infrastructure installation and use. EECA helped NZ Post with a study(external link) around chargers.
NZ Post did note the value of having their own chargers in the event that additional charging is required during the day. Having those chargers on-site makes it easier for staff or contractors to charge their e-Vans when they aren't in use, or at night when they're parked up so they have a full charge at the start of the day. It's also more cost effective because NZ Post has a better energy rate and staff don't need to spend productive time waiting for their vehicle to charge at a public charger.
Model assumptions
- Vehicles are owned for five years before being sold.
- The residual value of vehicles is conservatively assumed at 35% of the purchase price (including GST).
- Annual travel distances are achieved over 225 working days per year.
- Vehicles are purchased outright with cash i.e. there are no financing costs.
- Vehicles are depreciated to their residual value, and a corporate tax rate of 28% is applied.
- Financials exclude the cost of charging infrastructure.
- Electricity, petrol and diesel prices are $0.12/kWh, $2.10/L, and $1.35/L respectively.
- Emissions factors for electricity and fuels were retrieved from Ministry for the Environment.
- Road user charges (RUC) of $72/1000 km were applied to diesel use. Other fuels do not include RUC.
- Licensing and servicing costs are from EECA’s Total Cost of Ownership Tool.
- Warrant of fitness, insurance, and tyre replacement costs were assumed identical to ICEs.
- Fringe benefit tax not considered as vehicles assumed to be used only for business activity.
Use our calculator
-
Vehicle Total Cost of Ownership Calculator
Compare the cost of buying, running and on-selling new electric vehicles with hybrid, petrol or diesel alternatives.