

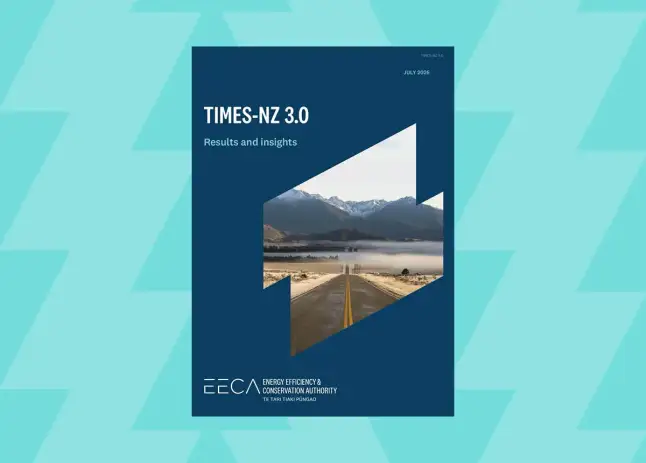
TIMES-NZ 3.0 insights report
TIMES-NZ 3.0 is a comprehensive model of the whole New Zealand energy system developed by EECA and the BusinessNZ Energy Council (BEC).
Using the model, EECA and BEC developed two TIMES-NZ energy scenarios to help people explore how New Zealand’s energy system could evolve over the coming decades and the impacts on energy use.
The scenarios use the TIMES-NZ 3.0 model to demonstrate two plausible, but different, energy futures called Steady and Shift.
Two realistic but different paths
The two scenarios show how four uncertain, yet crucial, factors could combine and interact to shape the energy system between now and 2050.
The four areas are:
- Economic structure and energy demand.
- Technology costs.
- Climate policy and societal trends.
- The role of gas.
These areas were chosen based on feedback from users of TIMES-NZ (including modellers, analysts and leaders from academia, government, businesses and industry associations) about what variables would be most useful to explore to help inform energy decisions today. Other variables, such as population, are the same between the scenarios.
-
Steady
Moderate change with more primary production (including strongly growing dairy and beef exports), moderate cost reductions for clean technologies (solar, wind and batteries, and EVs), lower carbon prices, more private passenger vehicle use, and an LNG terminal.
-
Shift
Faster change with more growth in advanced manufacturing, data centres, and renewably powered industries. Faster cost reductions for solar, wind, batteries, and EVs. Higher carbon prices, lower private passenger vehicle use and waste-reduction efforts generating more feedstock for biomass and biogas (wood waste and landfill gas).
Insights from comparing Steady and Shift
Steady and Shift are both realistic scenarios, although neither will exactly represent the future. Importantly, they are also not upper and lower bounds for any energy variable, nor do they represent any specific set of potential government policies or recommendations.
Energy demand
Total energy demand falls in both scenarios, as electrification and greater energy efficiency leads to less energy being needed, even as demand for the end uses of energy grows (such as travel, business activity, staying warm). In Steady, total energy demand falls 10% by 2050, and in Shift it falls 22%. In Shift, a greater share of demand (53%) can electrify, leading to higher electricity use and lower fossil fuel demand.
Value of flexible electricity use and batteries
Across the whole energy system, flexible electricity use can save energy users between $5.4 and $20.8 billion through to 2050. The results show that a rapid expansion of flexible electricity use and battery capacity is important for a secure and affordable energy system.
Batteries and other technologies that enable flexible electricity use (including smart home appliances that can shift demand on the electricity grid away from peak periods, such as winter evenings) play a key role in the evolving energy sector. They become even more important in the Shift scenario, which has higher rates of renewable electricity generation.
The biggest savings occur when smart control of hot water cylinders and other appliances combine with uptake of batteries to lower the cost of electricity enough to make it an affordable option to replace many fossil-fuelled activities.
Emissions
Road transport electrification is the single largest driver of energy related emissions reductions across the energy system in both scenarios. However, the scale and rate of emissions decline is strongly affected by how quickly New Zealand adopts clean technology, particularly electric cars and trucks. Declining domestic gas supply and an increase in renewable energy generation also drive emissions reductions in both scenarios. The combined impact is that by 2050, the Shift scenario’s emissions are less than half that of Steady. Shift’s greater drop in emissions is driven by a range of factors, including lower costs for wind, solar and batteries, and EVs, and higher carbon prices.
Costs
The total cost of meeting energy demand from 2023-2050 is roughly $1.3 trillion, or approximately $45 billion annually. For context, this is roughly 11% of annual GDP, which was $393 billion in 20231. However, costs in the Shift scenario are roughly $42.7 billion lower than in Steady across the whole model period (2023-2050), or $1.6 billion lower annually. This is because of lower clean technology costs, more available technology, and greater energy efficiency.
Renewable electricity
In both scenarios, the renewable share of electricity generation grows over time, and contributes to lower energy system costs. This is to be expected, as gas and coal generation plants retire and new plants are dominated by lower-cost solar and wind generation, alongside geothermal and hydro. However, it remains challenging to move to a 100% renewable electricity system: In Steady, the renewable share of electricity generation reaches 93% by 2050, while in Shift it reaches 98%. While hydro-power, geothermal generation, flexible electricity use, and batteries all contribute to balancing supply and demand (and more so in the Shift scenario), the model finds that fossil-fuel generation is still often the most effective solution for meeting peak electricity demand and grid firming, even with higher carbon prices.
Replacements for natural gas
Although domestic natural gas supply falls in both scenarios in line with government projections, the model finds that many existing uses of industrial heat, such as meat or dairy processing, can be cost-effectively electrified or converted to biomass or biogas. In the Shift scenario (where there is policy support for biogas and biomass in the form of waste-minimisation rules, for example requiring more diversion of organic waste from landfill) the model finds that up to 50 PJ of biomass can be cost-effectively used for energy annually, and nearly 40 PJ of biogas. Combined, this represents approximately one third of chemical (solid, liquid and gas) fuel supply in 2050, compared to around 6% in 2023.
Use of liquid natural gas
While the model is not designed to undertake a full cost-benefit analysis of constructing a liquid natural gas (LNG) import terminal, the results indicate that imported LNG could support energy demand under certain conditions. In the Steady scenario (where an LNG terminal is built), LNG at a marginal cost of $25/GJ is a cost-effective source of energy after 2032, and is used for electricity generation, and in the industrial, residential and commercial sectors. This date coincides with indigenous supply falling below 50 PJ/annum and the assumed retirement of the Huntly Rankine units.

Explore the TIMES-NZ 3.0 model
The insights from these NZ energy scenarios are based on the third and latest iteration of the TIMES-NZ model, which was developed by EECA and the BusinessNZ Energy Council (BEC).
It uses a detailed database of energy system demands, technology costs, and energy supply options to consider how supply and demand interact across the energy system.
The updated version is a world-leading and comprehensive model designed to produce the lowest-cost solution to meeting energy demand in any scenario.